Published June 28-July 7, 2020
1
A year or so ago, a friend recommended “The Outsiders.” It is a book by William Thorndike about eight of the most successful CEOs as measured by the increase in their company’s per share price. As Thorndike explains: “The metric that the press usually focuses on is growth in revenues and profits. It’s the increase in a company’s per share value, however, not growth in sales or earnings or employees, that offers the ultimate barometer of a CEO’s greatness…In assessing performance, what matters isn’t the absolute rate of return but the return relative to peers and the market. You really only need to know three things to evaluate a CEO’s greatness: the compound annual return to shareholders during his or her tenure and the return over the same period for peer companies and for the broader market (usually measured by the S&P 500).”
I liked the fact that one could distil performance down to a single number. I was reminded of this recently when Fortune had an article recently about the success and popularity of the Net Promoter Score (NPS). Wrote Fortune: “All this devotion for a particular measure of customer sentiment? It may seem bizarre, but the phenomenon is real and growing. At least two-thirds of the Fortune 1000 use the Net Promoter Score, including most or all of the financial service companies, airlines, telecom companies, retailers, and others. Quietly, steadily, without anyone much noticing, NPS has moved into the C-suites of most big companies and the owners’ offices of thousands of small ones—extending its reach deeply and broadly through the global economy. Skeptics and enemies have largely been vanquished. It is now used in every developed economy and many emerging ones. It’s pored over in all types of organizations, not just businesses; in Britain, the National Health Service uses it. As organizations everywhere obsess over the customer experience, NPS’s advance across industries and countries is, if anything, accelerating.”
This set me thinking. Just like a CEO’s performance over time could be measured via the increase in the company’s per share value and consumer sentiment could be assessed via NPS, could something similar be done to predict revenue?
2
The one number that has attracted a lot of attention in the past few months is R0 – the reproduction number, which tracks how contagious an infectious disease is. If it is less than 1, it means that each existing infection causes less than one new infection and hence the disease will eventually die out. An R0 greater than 1 leads to an epidemic, as we have seen with the coronavirus.
Single number performance measures are all around us. A country’s economic performance is measured by GDP (gross domestic product) growth rate. A student’s performance is assessed by a rank or a grade. A company’s business performance is captured by its PAT (profit after taxes). A fund manager’s performance and pay could be tied to the alpha – the difference compared to a benchmark index. For high-growth software companies, an interesting metric is what is called the Rule of 40 which says that the company’s revenue growth rate and its profitability margin should be at least 40.
In all cases, a whole array of numbers is distilled down to a single number that can be tracked over time and compared with others. In this context, it is instructive to look back to the Harvard Business Review article in 2003 by Frederick Reichheld which sparked the Net Promoter Score (NPS) revolution.
It took me two years of research to figure that out, research that linked survey responses with actual customer behavior—purchasing patterns and referrals—and ultimately with company growth. The results were clear yet counterintuitive. It turned out that a single survey question can, in fact, serve as a useful predictor of growth. But that question isn’t about customer satisfaction or even loyalty—at least in so many words. Rather, it’s about customers’ willingness to recommend a product or service to someone else. In fact, in most of the industries that I studied, the percentage of customers who were enthusiastic enough to refer a friend or colleague—perhaps the strongest sign of customer loyalty—correlated directly with differences in growth rates among competitors.
… By substituting a single question for the complex black box of the typical customer satisfaction survey, companies can actually put consumer survey results to use and focus employees on the task of stimulating growth.
So, what can the equivalent of NPS be to give a forward-looking view on what customers will spend with the business? What is the one number that can predict future revenue?
3
For me, the search for the magic number for marketing started with the presentations on Velvet Rope Marketing (VRM) that I started doing to CMOs a couple months ago. (As an aside, this is one place where the lockdown has proven very effective. I would probably have not travelled as much for the meetings in India, South East Asia, Middle East and Africa. But here I was, working from home, meeting CMOs and their teams all across diverse geographies. Over the past two months, I have done over 60 VRM presentations with Netcore customers and prospects.)
As I dug deeper into VRM and improved on my pitch with the feedback that I received, I realised I had developed a whole new vocabulary:
- Power Laws in Marketing: a small percentage of customers account for a large chunk of revenues and an even greater share of the profits
- Velvet Rope Marketing: to emphasise the focus on the Best Customers
- Best-Rest-Test Customers: to segment their customers based on CLV (customer lifetime value)
- Long Tail Marketing: to improve returns from Rest and Test customers
- Best Customer Genome: the DNA of the Best Customers
- Chief Profitability Officer: what the CMO and every CxO needed to become
Yet, there was something missing. I was unable to show how the improvements brought about my VRM could be quantified. While I spoke about an increase in profits, I realised that there were many contributors for profits and it would be hard for VRM to be recognised as the main component.
While CMOs liked the idea, I realised that I struggled to show how the VRM approach could be more effective than the marketing techniques they were using internally. I needed a number that could show a before-after impact of VRM. While CLV was good at an individual customer level, it did not help in capturing the overall impact across all customers. Perhaps, the trick lay in aggregating CLV across all of a company’s customers? I had to dig deeper.
4
It was then that I re-read an article by Daniel McCarthy and Peter Fader in the January-February 2020 issue of Harvard Business Review about Customer-based Corporate Valuation (CBCV). This excerpt stood out:
Recognizing that every dollar of revenue comes from a customer who makes a purchase, CBCV exploits basic accounting principles to make revenue projections from the bottom up instead of from the top down. Although this may seem like a radical departure from traditional frameworks, that’s not the case: CBCV simply brings more focus to how individual customer behavior drives the top line.
What do we need to implement CBCV? In addition to the usual financial statement data, two things are required: a model for customer behavior (what we call the customer-base model), and customer data that we feed into it. The model consists of four interlocking submodels governing how each customer of a firm will behave. They are:
- the customer acquisition model, which forecasts the inflow of new customers
- the customer retention model, which forecasts how long customers will remain active
- the purchase model, which forecasts how frequently customers will transact with a firm
- the basket-size model, which forecasts how much customers spend per purchase
Bringing these models together enables us to understand the critical behaviors of every customer at a firm—who will be acquired when, how much they’ll spend over time, and so on. Summing up all the projected spends across customers gives us our quarterly revenue forecasts. Together, these models can produce much more precise estimates of future revenues streams—and from that, one can make much better estimates of what a company is really worth.
As outlined by McCarthy and Fader, CBCV is an excellent metric for measuring performance of public companies who can be expected to disclose the data. What I needed was similar but also simpler – which CEOs could easily track. And that is where the idea of Net Predicted Revenue (NPR) came up – a way to estimate the revenue from all future customers, factoring in churn and new acquisition. Could NPR do for a business what NPS did for customer loyalty? Could NPR be the one number that “solved marketing” the way Jim Simons of Renaissance Technologies solved the market?
5
Before we discuss the power of Net Predicted Revenue (NPR) as marketing’s magic number and the one number which according to me ‘solves marketing’, let’s start with the basics.
A company has customers. What it knows for sure are its past transactions with these customers.
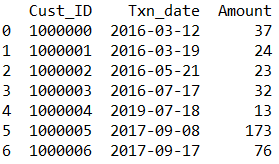
Aggregate all these transactions in a specific period and you have the revenue for a day, month, quarter or year.
Just by looking at these numbers it is not easy to predict the future. One could extrapolate based on growth. So, if revenues have grown by 20% for each of the past three quarters, one could expect future revenues to also grow by 20%. But that does not tell the marketer who will spend how much and which customers are at risk of churning. This is where the concept of customer lifetime value (CLV) comes in. It is the present value of the future revenues from a customer. (The calculation is akin to the discounted cash flow model that companies use to calculate current valuation.)
Once we are able to calculate the CLV for each customer, we can get an aggregate view of future revenue from all customers – think of this as the Predicted Revenue. This is at a single moment in time. It is simply the area under the CLV curve, where the Y-axis has the CLV numbers, and the X-axis sorts all the customers from the highest CLV to the lowest.

So, by using CLV for each customer, we are able to calculate the forward-looking revenue for the business. What we then have to factor in is that some customers will be lost (churn) and new customers will come in (acquisition). Taking both these changes leads us to Net Predicted Revenue (NPR).
6
Customer lifetime value (CLV) is important because all customers are not equal. In fact, most businesses will find that there is a power law with CLVs. As explained by Wikipedia, a power law is “a functional relationship between two quantities, where a relative change in one quantity results in a proportional relative change in the other quantity, independent of the initial size of those quantities: one quantity varies as a power of another. For instance, considering the area of a square in terms of the length of its side, if the length is doubled, the area is multiplied by a factor of four.” This is how a power law curve looks:

It is not surprising that CLV curves look very similar! This is similar to the 80-20 rule, where 80% of value comes from 20% of the base. (The specifics may vary – it could be 90-10 or 60-20.) For most businesses, a small number of customers account for disproportionate value (revenue and profits).
Power laws are common in product sales. A few “hits” account for the bulk of the sales, followed by the long tail, as shown in this graph below from TechnoLlama:

There is an excellent collection of charts in a post by Michael Tauberg which shows power laws all around us:

Tauberg explains power laws simply: “Basically, power law is like a forest. There are tall trees which soak up the sun and grow to be enormous. Then there are all the shrubs on the forest floor.”
Below is a real demonstration of the power law from one of our customers – the hand-drawn green curve shows the power law at work.

The lesson for business leaders is to recognise the presence of power laws in their revenue charts. Calculating forward-looking and predictive CLV brings this to life. It also leads to another conclusion: businesses and marketers need to take exceptional care for customers who are at the high-end of the CLV charts. Focusing on these customers is what Velvet Rope Marketing is about.
In this context, what Net Predicted Revenue (NPR) does is provide a glimpse into the future. It shows what revenues a business can generate going forward from all its customers. The good thing about NPR is that it is calculated one customer at a time. Making a single customer the unit of analysis takes us to one of the most important ideas from the world of economics.
7
NPR as we have discussed is a bottom-up way of predicting future revenues. It starts with the actions of a single customer. Will that customer stay? Will that customer spend? Will that customer churn? Past actions as computed through an RFM (recency frequency monetary value) grid help compute the probabilities for what a single customer will do.
What is important here is the focus on a single customer. There is an equivalent idea in economics that is focused on a single individual as the unit of analysis – the concept of “methodological individualism.” Here is an explanation from The Encyclopedia of Libertarianism:
According to Ludwig von Mises, methodological individualism views “all actions [as] performed by individuals”—or, in the words of Karl Popper, that social phenomena “should always be understood as resulting from the decisions, actions, attitudes, etc., of human individuals, and that we should never be satisfied by an explanation in terms of so-called ‘collectives’ (states, nations, races, etc.).”
So, even as we think about customers as the collective, it is the single customer that should serve as the basis of analysis and action. The idea of CLV assigns a future revenue value to each individual customer. It is a bottom-up model, rather than just top-down extrapolation. It is forward-looking and predictive, rather than taking a number from the past.
In the real world, customers are masters of their own preferences. As such, they can continue with a brand or they can switch to another brand to get their job done. One brand’s churn is another brand’s acquisition. By starting with predicted revenue and layering churn and acquisition, it is possible to arrive at Net Predicted Revenue (NPR).
This becomes the most important metric for a marketer – change in NPR over a period of time will help provide early indications of the future health of a business. It is a lead indicator, a crystal ball into the future. NPR is the single magic number that CEOs who think profitability (rather than chase valuations) should be focused on.
8
To better understand how NPR can be applied, a business can start by charting the CLV for each customer.

Next, sort the customers by CLV from high to low on the X-axis.

And what do we see? A curve which looks like the power law!
We can then segment the customers into Best-Rest-Test.

Marketers and business owners can then get to work on the customers to grow the CLV. In the graph below, the brown area shows how the predictive CLV changes for some customers leading to an increase in the area (which is the predicted revenue).

In this case, what has not been factored in is churn and new customer acquisition. Also, the customer acquisition costs (CAC) have been ignored.
These charts show how the CLV calculation can help in predicting revenue. Business leaders can now get a forward-looking impact of their present-day customer-centric initiatives. Given that costs are more directly under the control of the leaders, Net Predicted Revenue (NPR) is the one number that can thus be used to predict revenue – and perhaps profits.
9
This single chart brings together the ideas of Velvet Rope Marketing and Net Predicted Revenue.
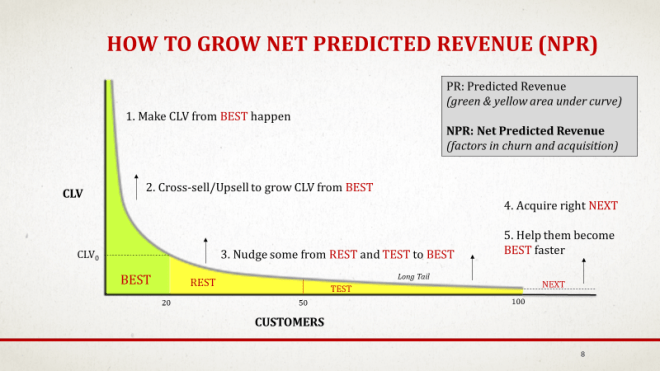
Once the CLV for all customers has been calculated, we get the Predicted Revenue for all present customers. This is indicated by the green and yellow areas under the curve. (Best Customers are the top 20% customers with a CLV greater than CLV0, while the middle 30% customers have been labelled Rest and the bottom 50% as Test.)
Marketing’s objective is simple: grow the area under the curve. This is what VRM does and NPR measures.
There are 5 actions that marketing needs to do:
- Make CLV from the Best happen: this is the core of VRM – how to provide amazing experiences to the Best Customers so they do not churn. At a minimum, the projected CLV is what must be realised.
- Cross-sell/Upsell to grow CLV from the Best: this is about increasing the green area by pushing the curve higher. This is where a good understanding of the customer genome combined with a martech platform to implement VRM can help create what we can think of as “100% customers” – where a brand monopolises the complete spending of the customer in a category.
- Nudge some from Rest and Test to Best: this can be done by analysing the Best Customer Genome, identifying the next best action for each customer, and creating the future pipeline of new Best Customers to replace some who will inevitably churn.
- Acquire right Next: this is about using information about Best Customers to acquire lookalikes so that the wastage that is ever-present in new customer acquisition can be reduced
- Help them become Best faster: this is about providing a super onboarding process for likely Best Customers to ensure they can cross the CLV0 spending threshold sooner than later
10
What can you do as a business leader? Here are the 7 steps to getting started with the ideas and apply the ideas of NPR in your business:
- The starting point is transaction data. Collate customer-wise transaction data for the past few years.
- Calculate Customer Lifetime Value (CLV) for these customers. Remember that CLV mentioned here is predictive and forward-looking.
- Plot the CLV-Customers chart and see the power law at work
- Based on this, you can calculate the Predicted Revenue – the aggregate CLV for all present customers
- By factoring in loss of revenues due to expected churn and additional revenue via new customer acquisition, you can get the Net Predicted Revenue (NPR)
- The next step is to apply the ideas of Velvet Rope Marketing (VRM) to grow revenue from the Best Customers, get some of the Rest and Test Customers to become the Best, and acquire Next Best Customers who are likely to have a higher CLV (see graphic below)

- Set up a process by which the CLV and NPR calculations are automated and available periodically to all decision-makers.
Through these actions, you can now view in near real-time the impact of the marketing activities on a forward-looking basis through the lens of customer actions. NPR should thus become the single business number to discuss strategy and drive new initiatives.
These are ideas which can be applied to every business in every industry. By calculating NPR across time, one can see the impact of customer-centric initiatives. NPR thus allows vendors to become partners because the impact of each action can be measured, and thus gainshare models can be applied to customer acquisition, retention and development. For the first time, business leaders can get a measurable marker for future profit growth. The CLV-VRM-NPR triad is the path for every business leader to rise to the most important position in today’s challenging times – becoming the CPO (Chief Profitability Officer).